Showing posts with label SDO magnetic fields. Show all posts

Thursday, April 2, 2020

Hale’s Polarity Law in Solar Cycle 25

The magnetic field of the Sun has several patterns and follows a few laws. Hale’s Polarity Law is one of those. It says that the leading and trailing magnetic fields in an active region have the opposite direction and the directions flip in the next sunspot cycle.
Here is proof of the flip going into Solar Cycle 25. On the left is an HMI magnetogram from April 3, 2011, during the rise to the maximum of Solar Cycle 24. There are several active regions in the Northern hemisphere of the Sun. The magnetic field going into the Sun is shown as black and the outward field in white. Arrows point to three active regions (AR 11180, 11183, and 11184, right to left arrows) and show that the inward field leads the outward field.

On the right is a magnetogram from April 2, 2020. A high-latitude active region (AR 12759) has the outward field is leading the active region and the inward magnetic field is behind. AR 12759 is at 28 N (the same latitude as Cape Canaveral, FL, SDO’s launch site).

Hale’s Polarity Law is one of the reasons for the confusing names of the solar cycle. People see an 11-year sunspot cycle when they look only at sunspots. The reversal of the leading and trailing fields means that two sunspot cycles are necessary for the Sun to return to the same conditions (the 22-year solar cycle). But we still count Solar Cycles. So Solar Cycle 25 is the 25th sunspot cycle since records the numbering began in 1755.

The high-latitude, oppositely-directed field active region AR 12759 is just the beginning of Solar Cycle 25.The leading field is an outie!

Thursday, June 21, 2018

Happy Summer Solstice 2018!

Today, June 21, 2018, at 1007 UTC (6:07 am ET) the Sun reached its northernmost point in our sky. In the northern hemisphere we have the longest day of the year while people in the southern hemisphere have their longest night. Six months from now we will reverse places for the Winter Solstice. It's all due to the tilt of the Earth's rotation axis that tilts us toward the Sun in northern summer. Our ancestors often celebrated the Solstices with parties. I'll celebrate with some pictures of the Sun.

For those who thought Solar Cycle 24 had faded into history, please look at today's Sun. There are three active regions visible on the Sun and a sunspot number of 52. This blended image overlays an HMI magnetogram with an HMI continuum image. Helioviewer.org has provided pointers to the active regions. (The little β describes the complexity of the active region.) All three regions are at low latitudes in the northern hemisphere of the Sun and have the black magnetic field leading the white, so they are Solar Cycle 24 sunspots. Another region of Solar Cycle 24 field is visible on the left and will soon rotate into view.
Even as Solar Cycle 24 fades, we see the signs of the next cycle. Here is an AIA 171 Å image, also with the active regions pointed out. I added two arrows to the dark patches at the poles of the Sun. Those polar coronal holes contain the seeds of Solar Cycle 25. The strength of the polar magnetic field says that Solar Cycle 25 will be a little more active than Solar Cycle 24. We only have to wait until 2025 to find out.

Thanks to Helioviewer.org for the labels.

Enjoy the Solstice!

Friday, April 13, 2018

The First Signs of Solar Cycle 25

On 20-Dec-2016 a USET observer saw a small patch of magnetic field in the southern hemisphere of the Sun. The outward magnetic field (white in the magnetograms) was behind the inward field (black patches). This patch is circled in blue in the HMI magnetogram. This high-latitude region (23°S) did not follow the pattern of magnetic field seen in Solar Cycle 24. George Hale noticed that sunspots tended to have a definite pattern of their magnetic field. One hemisphere has the patch of inward field leading the outward. The other hemisphere has the opposite pattern. During the next sunspot cycle the hemispheres reverse patterns.

The arrows in the magnetogram point to magnetic fields that follow Hale’s law for Solar Cycle 24. The blue arrows point to areas that show the pattern for the northern hemisphere and the single red arrow the southern. Even the broad areas of magnetic field in the northern hemisphere follow this pattern.

The magnetic field in the patch of magnetic field in the blue circle has the black leading the white — a sign that it is related to Solar Cycle 25, especially because it is at higher latitudes than most of the sunspots seen around this time. This is another pattern in sunspots. They tend to appear at higher latitudes early in a cycle and appear at ever-lower latitudes as the cycle progresses.

So, this little patch of magnetic field has two reasons to be the “First Sunspot of Solar Cycle 25.” It only needs to be seen as a sunspot and assigned an Active Region number.

The first observer notified other members of USET and one of them went and looked at the Sun. There was a small sunspot where the patch of magnetic field was seen. It was assigned the number AR 12620. It is the small black dot above the label in the orange HMI continuum image. Only one of the four other patches of magnetic field in the magnetogram was also visible as a sunspot (AR 12619). Looks like we have a winner!

Why mention this now? Because Sam Freeland saw another high-latitude (31°S), reversed-polarity patch of magnetic field in the southern hemisphere on 8-Apr-2018 (top panel of picture, the brightest area is the corona above the magnetic patch in an AIA 193 Å collage). This time the patch appeared and faded without forming a sunspot and did not receive an active region number. But Freeland saw a small flare at 12:57 UTC on 9-Apr-2018. This A2.5 flare may also be visible as a small blip in the GOES 14 X-ray flux (bottom panel, arrow points at blip).

Each Solar Cycle overlaps with the ones before and after. We study this overlap in our quest to understand the solar magnetic field and the dynamo that creates it. Our modern data, especially the full-disk magnetograms, makes looking for these overlapping regions a little easier.

As solar minimum draws near, we will see fewer sunspots but more and more of them will have the properties that put them into Solar Cycle 25. Eventually, solar minimum will be reached and after that sunspots associated with Solar Cycle 25 will become the majority. That should happen in 2020.

It is good to see that solar activity will continue to fascinate us in Solar Cycle 25.

Wednesday, March 9, 2016

100,000,000 Images from HMI!

Here is the 100,000,000th image seen by HMI! It was snapped yesterday (March 8) at 0453 UTC (11:53 pm ET on March 7). Unlike the 100,000,000th AIA image we talked about last year, most people don't look at the individual HMI images. HMI images are processed and manipulated to make Dopplergrams and magnetograms.

My congratulations to the Stanford and LMSAL team that built and now run the HMI instrument. The Dopplergrams, magnetograms, and intensitygrams that we see everyday are the result of their excellent work. They are used by space weather forecasters around the world to track what the Sun is doing. The Dopplergrams have been used to look at how material moves around deep inside the Sun's convection zone.

Another 100,000,000 HMI images please!

Friday, May 1, 2015

Happy 5th Birthday to SDO Science Data!

Today is the 5th birthday of SDO Science Data. On May 1, 2010, SDO was commissioned as a NASA observatory and began sending science data to scientists and the public. We have watched Solar Cycle 24 rise to solar maximum, storing about 7 PBytes of data, releasing almost 200 million images, and having about 1900 scientific papers published describing new things we have learned.
I thought I would share two new images that show the solar magnetic field as only SDO can. The first is the average of the HMI magnetic field at each point on the Sun. White areas show where the magnetic field points out of the Sun and black regions are where the field points into the Sun. Grey regions have a magnetic field of zero. The Carrington longitude is used to give features on the Sun a position. We use the sine(latitude) rather than the latitude to avoid having the Sun look distorted like the Mercator maps of the Earth. The little circles are individual active regions. Even though this is an average over the last 5 years, we can see diagonal swaths of field in both the north and south hemispheres.
The other picture is how much each point on the Sun changed over those five years. The white points changed a lot while the black points changed very little. Now you see the diagonal lines a little better. Most of the changes in the solar magnetic field happen in the "active latitudes" where sunspots and flares are found. Very little happens at high latitudes. There is also very little happening along the Sun's equator.
You should compare these pictures with the averages of AIA 171 released two years ago.

SDO was launched to study the Sun's magnetic field. It is done a great job of recording the magnetic field, flares, filaments, and coronal holes during the rise of Solar Cycle 24. As Solar Cycle 24 fades SDO will continue to measure and report the magnetic field and what that magnetic field does in the solar atmosphere.

Thanks to the HMI for creating the maps of the magnetic field I used to create these pictures, and many thanks to the entire SDO team for the amazing mission they have run for the last 5 years.

SDO is GO!

Thursday, July 10, 2014

What Is a Magnetic Field?

Recently I was working at the City Skies Solar Workshop at the Franklin Institute. This program brings middle school teachers and community center leaders together to provide STEM activities at the centers with the teachers ensuring the science content. It’s a really nice program that SDO has worked with for two years.

During the June workshop one of the center leaders asked, “What is a magnetic field?” Now that should be an easy question to answer. SDO/HMI measures the magnetic field of the Sun (see today's solar magnetic field map on the left); we use compasses to find directions using the Earth’s magnetic field. So, what is a magnetic field? It wasn’t as easy to answer as I thought.

A magnetic field is one of the fields used to track forces. It gives us a recipe to describe magnetic forces around the source of the field.

Gravitational fields are used to describe the orbits of planets around the Sun. Electric fields describe how currents flow in the power grid and how radios work. A magnetic field is how we keep track of the magnetic force created by many moving particles (or electrical currents). There are two nuclear fields as well. Fields are not simple concepts. They do not follow our usual experiences. A concept like Newton’s law of motion, that force is equal to mass times acceleration, can be seen every day. But even though they are invisible, fields are as real as the forces they allow us to calculate.

The magnetic force doesn’t work in the way the electric and gravitational force work. Both of those draw particles together (or make them move apart for like electrical charges). Only moving charges can feel the force from a magnetic field. As soon as a particle feels the effect of a magnetic field it starts to move in a circle. The speed of the particle doesn’t change but the direction of the velocity does. This makes a magnetic field a good deflector of particles. There are only the holes at the poles that allow particles in.

Magnetic fields come from electrical currents, whether in the Sun or a magnet. The strength of magnetic forces can be greater than the force of gravity (that’s why magnets work) but it is weaker than the electric forces between charges. It also works when the source of the magnetic field is electrically neutral!

Magnetic forces from those fields push around moving charged particles. Those moving charged particles also produce a magnetic field. Interesting things, like the solar dynamo, happen where the strengths of the magnetic fields from the two sets of moving charged particles are about the same. By concentrating on what a magnetic field does to the charged particles moving through it we are acting like the scientists who first tried to understand why compasses were affected by electrical currents in nearby wires. They also mapped the shape of magnetic fields on Earth with iron filings (and more complicated instruments). On the Sun we can trace the magnetic field in the corona using EUV images (such as from SDO/AIA). Newer instruments can measure the actual coronal magnetic field, which can be compared with how the plasma moves in the EUV images. We use the Zeeman effect on iron atoms by measure the magnetic field near the surface of the Sun. Those scientists also began thinking about fields and started us down the road to modern physics.

What is a magnetic field? A magnetic field is the region of space near a body where magnetic forces due to the body can be detected. It’s the reaction of the particles that counts, not the region.

Edited 08/05/2014 to fix the bar magnet picture.

Friday, September 13, 2013

How Can Today's Sunspot Number be 22?

When I look at the HMI continuum image today I see only a few sunspots, which are circled in the picture on the left. But if I go to the SIDC website, their official Sunspot Number is 22! How can that be?

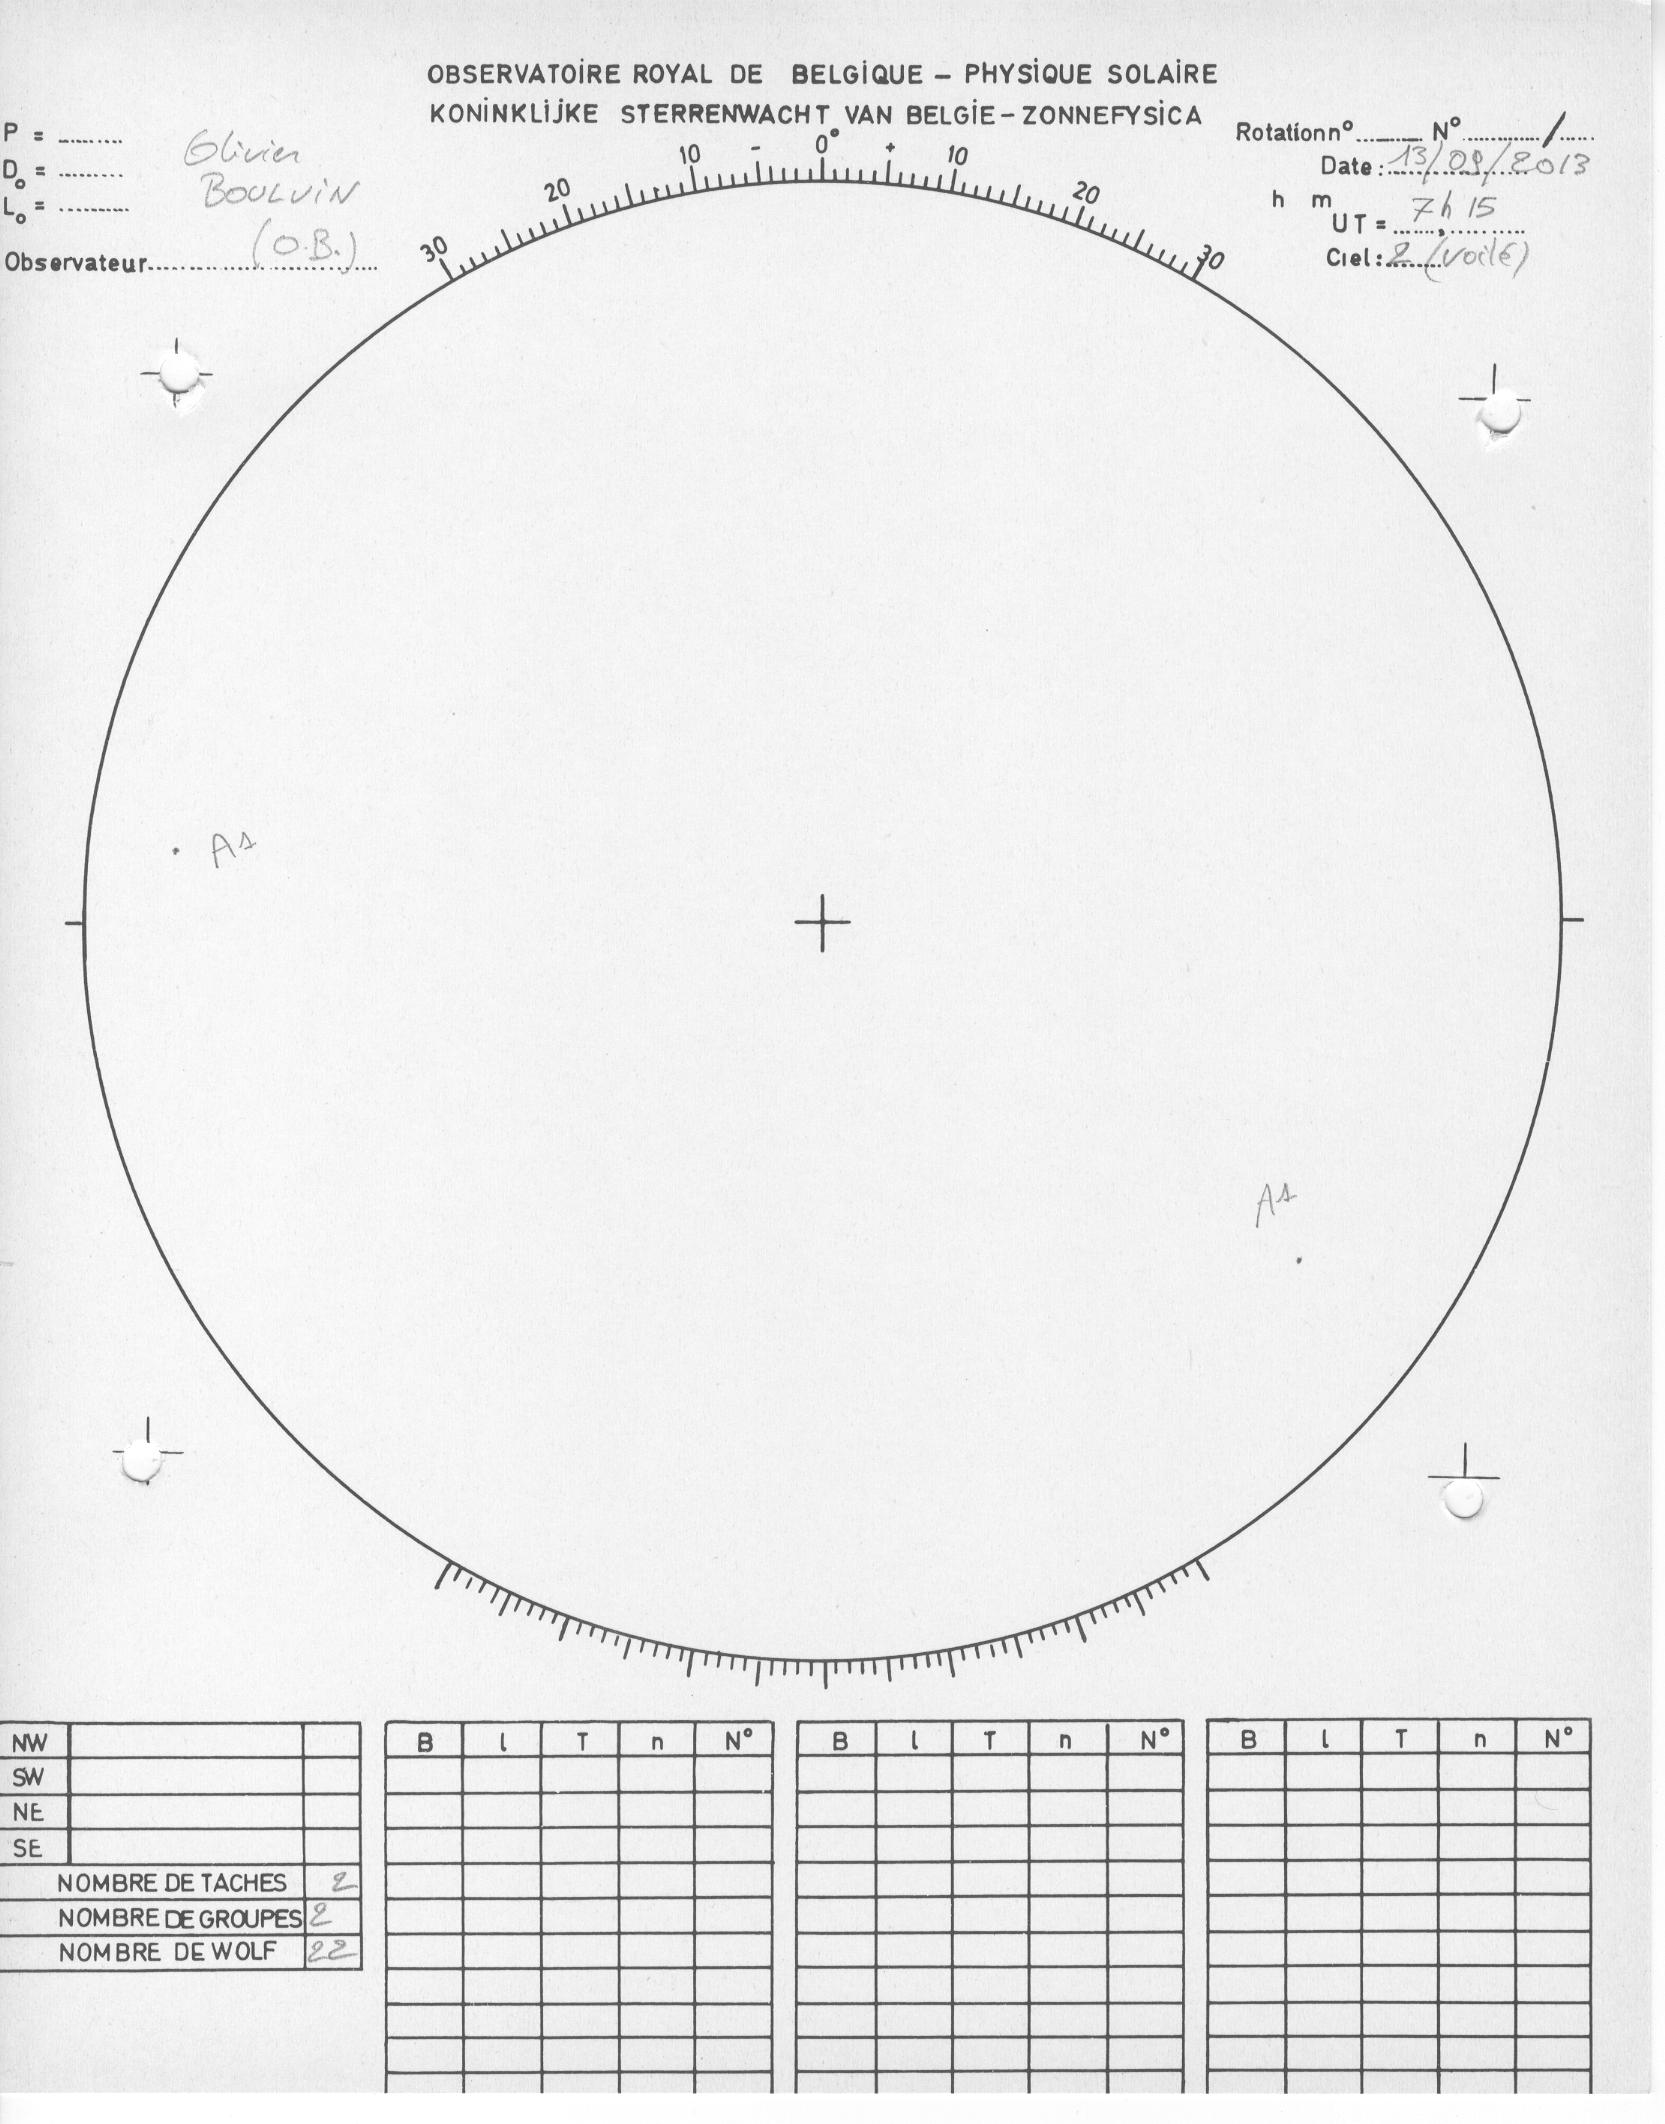
Rudolf Wolf, one of the first observers of sunspots, noticed that different people saw different numbers of sunspots on the same day. He realized that the different counts came from using different equipment. If you look at the Sun through properly filtered low-power binoculars you might see a few large sunspots while if you looked at the same Sun with a high-power telescope you might see many more. If you look at the Sun with young eyes you might see smaller sunspots than someone with older eyes. To deal with these differences, in 1848 Rudolf Wolf developed the Wolf Sunspot Number by combining the number of individual sunspots with the number of groups of sunspots seen on the sun through a telescope with an 80 mm aperture and a magnification of 64x. He defined the Wolf Sunspot Number as RZ = k(10g + s). To generate the Wolf Sunspot Number you had to measure

  • s = the number of individual sunspots
  • g = the number of sunspot groups (either a set of counted spots or a fuzzy blob that may contain more than one sunspot)
  • k = the observer factor (explained below)
Today RZ is also called the International sunspot number, relative sunspot number, Wolf number or Zürich number.

The observer factor (k) is a number that normalizes the sunspot number observed by any person to that of Rudolf Wolf. Each observer has their own value of k, which is usually between 0.4 and 1.7. Wolf included k so that he could combine observations from observers with eyes, telescopes, and cloudiness that were not the same as his. Assigning k’s to each observer allows us to average values of RZ from several observers to get the official sunspot number. You can also use k to account for how an observer's eyes change with time.

As a rule of thumb, if you divide the Wolf number by 15, you’ll get about number of individual sunspots visible on the solar disk. (This works better at large sunspot number and does not work today.)

I see two groups on the HMI image, the group on the left is a single spot while the group on the right has maybe three. That means my estimate of the Sunspot Number is RZ = k(10 x 2 + 1 + 3) = 24 if I set k to 1. The HMI telescope has a 140 mm aperture, which is larger than Wolf's telescope, so it sees more detail or smaller spots and gives a larger Sunspot Number.

Solar maximum is usually a time of large RZ but here we are watching solar activity fade to almost a spotless Sun. Although Solar Cycle 24 has not been creating a lot of sunspots, the Sun's magnetic field (see the HMI magnetogram at left) is still doing interesting things. You can see the magnetic field of the sunspots to the left and right of the image, while the large areas of magnetic field that support prominences and coronal holes cover the disk.

That's why we study the magnetic field!

Sunday, July 14, 2013

Which Way is North?

Compasses tell us which way is North on the Earth. It's easy, the needle with the big N points toward the North Pole of the Earth. Other directions can be read off the dial, like a primitive GPS!
Compasses work because the Earth has a simple magnetic field with the magnetic poles in almost the same place as the rotation poles. And the compass needle points along only the part of the magnetic field that is horizontal.
The Sun also rotates and has North and South poles. But compasses aren't very useful on the Sun. The solar magnetic field is very complicated and is usually vertical rather than horizontal. Now North and South refer to magnetic fields pointing out of and into the surface.
In an HMI magnetogram (such as one from July 15, 2013 on the left) we color the outward pointing fields as white and inward as black. The weak fields are grey.
So it is probably better to think of the solar field as outward (+) and inward (-) rather than North and South. That way you won't use the magnetic field to give directions on the surface of the Sun.
On the Sun it isn’t which way is North, but which way is up!