
Wednesday, December 20, 2017
Momentum Management Maneuver #31
Monday, November 20, 2017
Why Look at the Sun from Space?
What other satellites can you use to study the Sun?
Here are two sources (from many I could list) that can tell you about solar satellites from the dawn of space flight to today.
The first is Solar Satellites by Drs. Brian Dennis and Ryan Milligan. It is a web article on Scholarpedia with a list of 86 solar research satellites starting with the SOLRAD series that had its first launch in 1960. Dennis and Milligan also describe the instruments and observations on more modern satellites.
Another source is Watching the Sun from Space, which is available as a free download from the linked AJP website. This article starts with Skylab and traces the ways we observe the Sun from space. Links are provided for 27 solar missions, with data available for about 21. It also describes some orbits we haven't yet used to observe the Sun but could in the future.
Since the dawn of the Space Age during the decline of Solar Cycle 19, data from solar missions have been crucial in helping us understand the solar magnetic field and solar activity. Solar observatories in space continue to provide useful solar data and will as long as they keep flying and observing the Sun.
SDO should be around to watch Solar Cycle 25.
Wednesday, November 1, 2017
Is the Sun Getting Brighter?
SDO was built to study how the magnetic fields of the Sun are created and destroyed. AIA and EVE look at wavelengths of light that tell us a lot about those magnetic fields but are absorbed by our atmosphere and can’t be measured at the surface. HMI is designed to measure the velocity and magnetic field at the surface, not the total output of the Sun.
Other satellites in NASA’s fleet do measure the total output of the Sun, which we call the Total Solar Irradiance or TSI. One instrument on SoHO called VIRGO has measured TSI since 1996. Another instrument is TIM on NASA’s SORCE that is operated by the same group that built EVE. SORCE was very carefully calibrated and used to establish the baseline of TSI. VIRGO and other earlier satellites then provide the data since 1978.
Combining these data into a single measurement has been a challenge, but the people at LASP and the Physikalisch-Meteorologisches Observatorium Davos (PMOD) in Switzerland have risen to the task. The result is this figure. It shows the measured value of TSI from many satellites, spliced together into a single data set.

In the top plot, we drew the daily average of measured points in red (so there are a lot of points, 14187 to be precise). On the left is a red vertical bar showing a 0.3% change in TSI. The black curve is the average of TSI over each year. The dashed horizontal line shows the minimum value of year-averaged TSI data. The vertical black bar shows the 0.09% variation we see in that average. The bottom plot shows the annual sunspot number from the SIDC in Belgium in blue.
What do we learn from these plots? First, TSI does change! That’s why we stopped calling it the solar constant. Second, as the sunspot number increases, so does TSI. But the converse is also true. As the sunspot number decreases so does TSI. We have watched this happen for four sunspot cycles. This waxing and waning of TSI with sunspot number is understood as a combination of dark sunspots reducing TSI below the dashed line and long-lived magnetic features increasing TSI. SORCE has even observed flares in TSI.
Third, the horizontal dashed line is not an average, it is drawn at the lowest value in the year-averaged TSI data (that happened in 2009). When there are no sunspots the Sun’s brightness should be that of the hot, glowing object we always imagined it to be. We would expect TSI to be the same at every solar minimum. There is much discussion over whether the value of TSI at solar minimum is getting smaller with time, but it is not getting larger.
These data show us that the Sun is not getting brighter with time. The brightness does follow the sunspot cycle, but the level of solar activity has been decreasing the last 35 years. The value at minimum may be decreasing as well, although that is far more difficult to prove. Perhaps the upcoming solar minimum in 2020 will help answer that question.
To answer the question: No, we do not measure an increase in the output of the Sun that would cause the Earth to warm.
More information about the VIRGO instrument and how the composite (“spliced”) data is generated from the many measurements is at the PMOD website. The data I used was downloaded from ftp://ftp.pmodwrc.ch/pub/data/irradiance/composite/DataPlots/composite_42_65_1709.dat.
I highly recommend looking at the SORCE website for their data, which is how the absolute value of the composite was determined http://lasp.colorado.edu/home/sorce/.
The sunspot data is from http://sidc.oma.be/silso/datafiles. You can download the sunspot number is several formats for your analysis.
Note: Both data sets mark days where a measurement was not made with a negative number. These points were ignored when doing the averages.
Thursday, October 19, 2017
Today's Lunar Transit

Wednesday, October 4, 2017
EVE Field of View and AIA/HMI Flatfield Maneuvers today
Next Wednesday SDO will perform the EVE cruciform.
Wednesday, July 26, 2017
Momentum Management Maneuver #30 today, 1925-2000 UTC
Thursday, July 6, 2017
Remainder of 2017 Maneuvers and two Lunar Transits
- July 5, 1818 UTC 1320-1920 UTC (10:20 am ET - 3:30 pm ET) - EVE FOV and HMI/AIA Flatfield
- July 12 - HMI Roll Maneuver
- July 19 - EVE Cruciform Maneuver
- July 23, 1818 UTC (2:18 pm ET) - Handover Season Starts (HGA +Z slew from storage)
- July 24, 0449 UTC (00:49 am ET) - First Handover Begins
- July 26, 1940 UTC (3:40 pm ET) - Momentum Management Maneuver #30
- August 16, 0709 UTC (3:09 am ET) - Eclipse Season Starts
- August 21, 1927-1955 UTC (3:27-3:55 pm ET) - Lunar Transit
- August 30, 2241 UTC (6:41 pm ET) - Station Keeping Maneuver #15
- September 9, 0650 UTC (2:50 am ET) - Eclipse Season Ends
- September 25, 1942 UTC (3:42 pm ET) - Handover Season Ends (HGA -Z slew to storage, +Z Active)
- October 19, 1941-2025 UTC (3:41-4:25 pm ET) - Lunar Transit (26% coverage)
- December 20, Momentum Management Maneuver #31 (tentative)
Thursday, June 15, 2017
Measuring the International Sunspot Number


My thanks to the people at the SIDC for both hosting our meeting and giving me at backstage look at the solar observatory. You can get more information, including more drawings and pictures of the Sun, are the SIDC website.
Thursday, May 25, 2017
Today's Lunar Transit
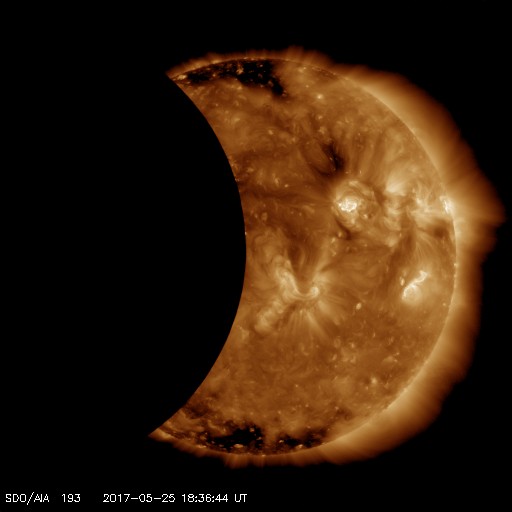

Always nice to see another member of the solar system paying a visit. See you again in August!
Tuesday, May 2, 2017
Seven Years of SDO Data!
We have updated a few things on the SDO Website. The kiosk movies will be turned off on May 31. Please migrate to the SDO Dashboard at https://sdo.gsfc.nasa.gov/data/dashboard/, which has a lot more flexibility in setting up the 48-hour loop movies. As an added attraction, we have added some higher cadence channels (such as the AIA 171 Å channel shown here). This channel has also been produced with a radial gradient filter that enhances the corona around the edge of the Sun.
Update May 3, 2017: Here's an example of how to embed these html5 videos in a website using the high-cadence AIA 171 Å channel.
Enjoy!
Wednesday, April 26, 2017
Server Maintenance - April 26, 2017
Today's Momentum Management Maneuver #29
During this maneuver the science data from SDO may be interrupted or contain blurry images.
Tuesday, April 18, 2017
A Movie of the August 21, 2017, Lunar Transit
Here is a video showing the lunar transit SDO will see on August 21, 2017. While some in the United States will see a Total Solar Eclipse, SDO will see only a glancing transit an hour after the Moon's shadow leaves the US and goes over the Atlantic Ocean.
Monday, April 17, 2017
Today's EVE Cruciform and the Next Few Months
- 2017/109 (04/19) EVE FOV/ HMI/AIA Flatfield Calibration
- 2017/116 @ 1825z (04/26 @ 1425L) - Momentum Management Maneuver (Delta-H) MM #29
- 2017/145 @ 1824 to 1917z (05/25 @ 1424 to 1517L) - Lunar Transit
- 2017/207 @ TBD (07/26 @ TBD) - Momentum Management Maneuver (Delta-H)MM #30 (tentative)
- 2017/228 @ 0709z (08/16 @ 0309L) - Eclipse Season Starts
- 2017/233 @ 1927 to 1955z (08/21 @ 1527 to 1555L) - Lunar Transit (LunTran_2017233_2dc_14pshdw)
- 2017/242 @ TBD (08/30 @ TBD) - Stationkeeping Maneuver (Delta-V) SK #15 (tentative)
- 2017/252 @ 0650z (09/09 @ 0250L) - Eclipse Season Ends
- 2017/292 @ 1941 to 2025z (10/19 @ 1541 to 1625L) - Lunar Transit (LunTran_2017292_2dc_26pshdw)
Tuesday, April 11, 2017
Website Update
The dashboard product is located at: https://sdo.gsfc.nasa.gov/data/dashboard/ and is available for testing and use. The new product is similar in that is displays a looping movie of the most recent browse images. However, we are utilizing html5 video technology instead of the javascript slideshow used in the kiosks. This allows you to build your display in a drag-and-drop environment rather than a static html reference.
We are moving to html5 to satisfy website security requirements and to provide a better product. Some users have reported a noticeable flicker with the current kiosk javascript slideshow. Although we were unable to reproduce this flaw, wet concluded that it could be caused by several reasons including browser idiosyncrasies. The javascript solution also had a small memory leak. This necessitated a periodic browser refresh. Our new solution solves these issues and we are excited for the transition.
Monday, March 6, 2017
Planned Outage for the SDO website
Thursday, February 9, 2017
Happy Launch-versary SDO!


On the left is the booster model and the right is a little display model of SDO. You can see more of the spectrum around the shadow of the nosecone. I think the rainbow looks pretty good on them. Reminds me of the sundog we saw during launch all those years ago.
SDO has helped to create over 2600 scientific papers since we began producing science data in May 2010. We are very happy that many young scientists are able to “cut their research teeth” in one of the 49 PhD dissertations that have been written using SDO data and science. People keep using helioviewer to look through the images and make movies.
Thanks for using our data. Many thanks to the science teams that keep SDO running.
Happy Launch-versary SDO!
Wednesday, January 11, 2017
January 2017 Maneuvers
Last Wednesday, January 4, 2017, SDO successfully executed Momentum Management burn #28. Science data is not available during the 30 minutes of the burn.
The EVE Cruciform calibration maneuver will take place next Wednesday at 1700 UCT (noon ET) and the HMI Roll on January 25, 2017, at 1500 UTC (10:00 a.m. ET).