Congratulations to the Stanford Team for their rapid repair of the JSOC!

Showing posts with label SDO Data. Show all posts
Showing posts with label SDO Data. Show all posts
Saturday, February 8, 2025
JSOC Repairs are Complete, Normal Data Services have Resumed
At 12 noon PT, 4 Feb 2025, the HMI/AIA JSOC at Stanford has resumed normal data services. A small fraction of the data files were lost and are being restored from a tape backup.

Thursday, January 9, 2025
JSOC Update and Schedule of Events
The JSOC repair continues. This week we have started serving 15 min cadence images from AIA and HMI for Space Weather operators and others at the SDO website https://sdo.gsfc.nasa.gov. Stanford continues to rebuild the full capability of the JSOC. Several pieces of electronics are delayed by the dreaded supply-chain issues we all thought were finally behind us. All of the science data will be available for available once the JSOC is restored.
The JSOC may be off-line, but SDO continues making observations and collecting data about our Sun during the maximum of Solar Cycle 25.
SDO continues doing all of the usual things of a satellite mission:
- 12/18/24: Delta-H #51
- 01/08/25: EVE Cruciform
- 01/10/25: Eclipse Season #30 Starts
- 01/15/25: EVE FOV (@1400 UTC) and HMI/AIA Flatfield (@1715 UTC) Calibration Manuvers
- 01/16/25: HGA Handover Season #30 Starts
- 01/22/25: Stationkeeping Maneuver #30 (@2320 UTC)
- 01/29/25: AIA GT/PZT Calibration (images may shake a little)
- 02/05/25: Eclipse Season #30 Ends
- 02/16/25: HGA Handover Season #30 Ends
Thursday, June 20, 2024
Celebrate Solstice 2024 with a Solar Fireworks Show!
Today is the Summer Solstice, the longest day in the Northern hemisphere and the shortest day in the Southern. That officially happens at 20:50 UTC (4:50 pm ET). This solstice is the first day of summer in the USA.
But it has nothing to do with the Sun. The solstice is caused by the tilt of the Earth’s rotation axis to its orbit. On the other hand, we are in the maximum of Solar Cycle 25. Active region 13664 was an excellent example of how an active region should behave during a solar maximum. During the 16 days that AR 13664 was visible from the Earth in May, it produced 99 flares, including 12 X-class flares.
I produced a video of AR 13664 to celebrate the solstice. I downloaded three-color AIA images from the SDO website AIA and GOES XRS fluxes from the GOES website for days between 01 May 2024 and 16 May 2024. After removing the blank and offset images taken during an EVE cruciform, there were 1522 valid images in those 16 days (99% of the possible 15-min images). The XRS flux had 21616 points that were greater than zero.
Using the JythonMusic synthesizer, the XRS fluxes were converted to MIDI percussion sounds and then into a mp4 file. There’s a lot of different drums and cymbals in the soundtrack. XRS fluxes below a C-class flare were made into rests. When the video is quiet the Sun’s activity level is low.
The AIA images and audio file were combined to give the Solstice Celebration Video shown here.
The video starts with sporadic flares and some visible activity. Once AR 13664 starts generating flares the sound and images quickly start to resemble a fireworks finale! As AR 13664 rotates out of view the activity level drops, even though new active regions have appeared. You can also see a few non-solar things, such as the apparent rotation during a calibration roll maneuver. The flare sounds and flares in the images are not exactly in synch as the images are not frequent enough.
The solar fireworks were only the beginning. The largest geomagnetic storm in over 20 years took place on 11 May 2024. It's nice to see some geomagnetic activity after the storm-poor Solar Cycle 24. Large solar and geomagnetic activity makes it more difficult to track satellites in low-Earth orbit to keep them from colliding but that’s why we study the Sun.
AR 13664 was a fascinating feature of Solar Cycle 25!
Wednesday, May 11, 2022
HMI as a Hi-Speed Coronagraph (updated)
The time in the header of the HMI movie turns out to be off by 3 hours (the movie runs from 1320-1342 UTC). Once I heard that, it was back to Helioviewer (https://www.Helioviewer.org, which now redirects to a GSFC website) to produce an AIA 221 Å movie. I selected the area around the flare and made a movie that covers between 1300 and 1400 UTC. Now there is good agreement in the presence and shape of the filament, even the change from upright oval to a more horizontal appearance. You can compare the movies yourself to see how well the HMI filament tracks the AIA 221 Å filament. The post-flare arcade is much easier to see in this movie.


You are right if you are thinking HMI was lucky. Here is an AIA 304 image of the same region from 1619 UTC of May 3, 2022. The large number of coronal loops makes it very difficult to track the filament seen in the HMI movie.The AIA 304 Å images at the corrected times are saturated and need more analysis to see the filament.
I also looked at the AIA 1600 Å passband and see a beautiful filament at 13:23:50 UTC. The filament is bright because it reflects light from the Sun towards SDO and emits its own light. Use Helioviewer to create your own movie of this passband to see the rest of the flare and filament liftoff.

Solar Cycle 25 is getting interesting!
A magnetic complex, destined to become Active Region 3006, was rotating into view on May 3, 2022, when it was the site of an X1.1 flare at 1309 UTC. Three hours later HMI observed a filament liftoff.
Junwei Zhao used all of the HMI frames to produce this movie of a filament liftoff and other evolution of the solar atmopshere above the nascent AR 3006.
This movie was made by using all of HMI’s 6 line-position intensities — not just the continuum images. Thus, this movie has an amazing 7.5-sec cadence, showing many more details than a 45-sec cadence movie. Because the data is from above the limb, Fe I 6173 is no longer an absorption line, we mostly see how it scatters light from the solar surface towards SDO. (The same is true when you look at filaments in Hα. The filaments are dark against the disk but are seen as bright prominences above the limb.) In this movie the on-disk signal is completely saturated so that the off-limb signal is more easily seen. This movie is also showing a reverse image of the off-limb pixels. The dark material would be bright in the original images. The images are 150" squares. The Sun is 1904" across on May 3, so the area seen in the movie is only 0.6% of the Sun's area.The movie clearly shows material being ejected from the Sun. Some material falls back towards the surface, but then stopped falling and was held there for a few minutes before the light faded away.
Another interesting thing is that a post-flare arcade formed right beside the limb. Although it is small and remains close to the limb, it was undoubtedly there for a few minutes.
This is the fourth off-limb flare captured by the HMI. The first three resulted in quite a few publications in studying the polarization of the off-limb flare loops, the emission mechanisms of the off-limb white flares, and studies coupling the white-light and UV/EUV/X-ray observations. This high-cadence movie shows that we still haven't figured out all of the ways SDO data can be used to study the Sun.

Thanks to Todd Hoeksema, Sushant Mahajan, and Junwei Zhao, all members of the HMI Team at Stanford, for discovering and providing the movies of this limb flare and filament liftoff.
I hope you enjoy this movie.
Thursday, February 17, 2022
SDO 12 Years on Orbit, Large Active Region Approaching?
Last week, we celebrated the 12th anniversary of the launch of SDO. This amazing mission is still going strong, measuring the beginnings of Solar Cycle 25 with the same data stream as Solar Cycle 24. The science teams of AIA, HMI, and EVE are one part of the success of SDO. They keep the data flowing to their research, other solar scientists, and the public. Some 440 million images are now stored in the JSOC and EVE SOC!
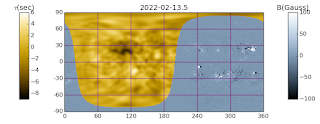 Here is a composite far-side image showing the magnetic field of the near-side (visble disk) of the Sun in greyscale and the time shifts of the far-side in color. A large active region (or sunspot) depresses the surface of the Sun and causes the wave to re-appear earlier than average. We can see a large region on the far-side with τ about -6 seconds.
The Flight Operations Team at Goddard Space Flight Center is another part of SDO’s success. The satellite and ground station are in great shape. FOT members help the science team by planning maneuvers to reduce the of time science data can’t be recorded. They have come to the MOC at odd hours to help resolve a problem and keep the data flowing.
But we shouldn’t forget the final team member, the Sun. And today we can see in the far-side images from February 13, 2022, that a large active region is sitting on the far side of the Sun. We should be seeing it rotate into view about 4 days from today (7 days from February 13). There are at least 4 numbered active regions on the Sun right now. How many will be there next week?
Far-side images come from analyzing the helioseismic data of HMI and similar instruments. They are useful to watch for active regions developing on the far-side of the Sun where we have little or no other information. Twelve years of HMI data have improved the far-side images, now we will benefit from that work during Solar Cycle 25.
SDO is GO!
Friday, February 4, 2022
Snow Disrupts Data
Accummulated snow in the SDO-1 antenna caused an outage in the SDO Ka science data from approximately 1815 UTC to 2310 UTC (1:15 pm ET to 6:10 pm ET) on February 4, 2022. The weather is improving in Las Cruces and we anticipate no further outages.
Tuesday, January 19, 2021
SDO Images will be on US Stamps in June!
According to this NASA News Release, SDO images will be featured on a set of USPS First Class Forever stamps. Here's what the stamps will look like.
SDO's 100's of millions of images of the Sun’s dynamic and dazzling beauty have captivated millions of people. Near the summer solstice of 2021 you should be able to use these select 10 as beautiful stamps. Watch for them!
Sunday, November 17, 2019
200 Millionth Image from AIA
In all the hype about the Mercury transit last Monday, we overlooked another milestone in the SDO mission. On November 5, 2019, the AIA instrument returned its 200 millionth image. Here it is and it's a beauty in the AIA 171 Å passband!
 The Sun looks like it is in solar minimum, with large polar coronal holes over the North and South poles. Hope for the future can be seen in the area with the black line drawn around it. That's active region 12750, a small bi-polar region that has the polarity of Solar Cycle 25 and an appropriately high latitude of 28°S. Other SC25 regions have been seen and they will become more frequent as SC25 starts its rise to maximum.
Mark Cheung, PI of AIA, made a movie to celebrate this milestone.

Congratulations to the AIA team for building a robust instrument that has returned excellent data for almost 10 years.
Wednesday, July 3, 2019
New Features on Website

The other is the ability to jump to earlier versions of the Sun Now page through the "Browse Daily Images" in the left column. You can enter a date and Jump to that day's images or Jump one day at a time.
These features were added due to feedback we received from users of the website.
Enjoy!
Friday, June 14, 2019
Listening to the Sun
Ever wish you could listen to SDO data? We have developed new ways to do just that!
 This paper converts several solar indices to sound before sonifying AIA images in three ways. You can listen to the entire image, small subsets of the image, and a series of images that shows a filament liftoff. We used a special math curve called a Hilbert curve to walk around the image and convert the pixels values into a set that can be then converted to sound. You should listen to the difference between the full image sonified with a Hilbert curve and sonified with a left-right scan. You will see a big difference.
 The next paper shifts HMI sound waves from their very low frequency of about 3 mHz to about 3 kHz so you can hear the tones.
This week the American Astronomical Society and the AAS Solar Physics Division had a joint meeting in St Louis. Astronomers and solar physicists got together to discuss our latest papers on understanding the Sun and universe.
Two of those papers were "Listening to the Sun" (by Kyle Ingram-Johnson, W. Dean Pesnell, and Kevin Addison) and "Listening to the Sun: the Sonification of Solar Harmonics Project" (by tim larson, Seth Shafer, and Elaine diFalco). Both papers allow you hear different kinds of SDO data. They were presented as iPosters, so they are available at the links below for others to read through and enjoy.


You are working to allow you to sonify images, both the entire image and as subsets, on the SDO website. Look for that new feature in the future.
Until then, please enjoy listening to the Sun!
Monday, February 11, 2019
Happy 9th Anniversary SDO!
Nine years ago today, at 10:23 am ET, SDO rose into the sky atop an Atlas V 401 launch vehicle. Since that day SDO has returned over 350 million images of the Sun, produced over 3000 scientific articles, and allowed millions to enjoy the Sun. Solar Cycle 24 was just starting in 2010. SDO watched it grow to maximum in 2014 and now the Sun is often spotless.
 Here is a summary slide of what SDO saw. The AIA 193 Å shows the lower corona and the HMI magnetogram shows the surface magnetic field. We try to understand the Sun by watching what happens at the poles. The dark areas near the North and South poles in the October 2010 and February 2019 193 Å images are the polar coronal holes. They have disappeared by solar maximum (the February 2014 images). The magnetograms show how the Sun's magnetic field gets more complicated at maximum and quite simple at minimum. What happens in the poles at solar minimum seems to be one of our best predictors of future solar activity.

SDO data is the basis of accurate models of the solar corona. Machine Learning algorithms are being used to squeeze even more information out of our 12 PB of data. We are looking forward to another lengthy lunar transit next month and the Mercury transit in November.
You can make your own SDO Anniversary movie at our website sdo.gsfc.nasa.gov or the Helioviewer website.
Happy Anniversary SDO!
Tuesday, October 16, 2018
HMI Focus Adjustments Today, Data may be Unavailable
Anything looking at the Sun tends to heat up. The SDO instruments have been looking at the Sun for 8.5 years. Although they are designed to look at the Sun for a long time, some changes still happen.
For example, the coatings on the HMI instrument housings and optical surfaces have been degrading slowly but steadily, causing the instrument to absorb more solar radiation and heat up. The front surface of HMI’s telescope is now hot enough that the HMI team is having difficulty maintaining proper focus. Without some adjustments, this problem will only get worse as the instrument continues to age.
For this reason, the HMI team is going to increase the operating temperatures of the front of the telescope and adjust the internal focus mechanism. This should give the instrument many more years of precise control and excellent data. The process of increasing the operating temperatures is a slow one — the team will begin heating the front telescope tube up at 1000 UTC on Tuesday, October 16, and will then wait six hours for the temperature to stabilize. The next step is to fine-tune the temperatures. These smaller changes will need about an hour for the temperature to become constant. Science data will not be available during the time it takes to bring the instrument back into focus. That also means there will be no magnetic field, continuum, or Doppler NRT data products.
HMI resumed taking science data before 2130 UTC, October 16. Fine tuning of the focus will occur Wednesday, October 17, but science data will not be interrupted.
Wednesday, March 9, 2016
100,000,000 Images from HMI!

My congratulations to the Stanford and LMSAL team that built and now run the HMI instrument. The Dopplergrams, magnetograms, and intensitygrams that we see everyday are the result of their excellent work. They are used by space weather forecasters around the world to track what the Sun is doing. The Dopplergrams have been used to look at how material moves around deep inside the Sun's convection zone.
Another 100,000,000 HMI images please!
Wednesday, February 4, 2015
Today's Maneuvers

Once the maneuvers are complete the usual data taking will resume.
Monday, February 2, 2015
Celebrate the "Year of Light" With a Beautiful SDO Image!

SDO is a great example of how astronomers use light to measure and understand our universe. AIA and EVE look at light from the Sun at very short, extreme ultraviolet, wavelengths. By comparing AIA images we can detect small motions of the corona. HMI looks at visible light. One nice property of light is that we can measure how it interacts with the Sun to measure things at the Sun that are otherwise difficult (if not impossible) to measure. We use the Doppler shift to see the wave motions and the Zeeman effect to see the magnetic field at the surface.
Light is a wonderful thing!
Tuesday, January 20, 2015
100,000,000 AIA Images!

The AIA team at LMSAL worked hard to design and build the AIA telescopes, even overcoming a delayed start way back at the beginning of the SDO project. The team continues to operate the instrument, keeping it calibrated and listing the features seen on the Sun. The HMI JSOC team at Stanford University maintains the archive that serves the images to our large and growing number of users.
Congratulations to the AIA team at LMSAL for designing, building, and running an excellent instrument for studying the Sun!
Thursday, January 15, 2015
100,000,000 on my Mind

The number 100,000,000 has been on my mind this week, especially as Monday approaches.
If I traveled 100,000,000 miles I could have gone to the Sun and been 7,000,000 miles on my way home by now.
100,000,000 seconds ago was Nov. 19, 2011, a day without great significance in my calendar.
100,000,000 people lived in the USA in 1914.

Here's a hint. SDO started returning science data on May 1, 2010. Tune in next week to find out what's up with 100,000,000!
Friday, November 7, 2014
Repairs are Complete, JSOC is Live!
The fiber optics cable is repaired and data is flowing to the JSOC. It's good to see the Sun!
Wednesday, November 5, 2014
JSOC Images Unavailable (Updated 11/6/2014)

Update 11/5/2014 2142 UTC: We have learned that the fiber cables between WSMR and Stanford were accidently cut. This outage will continue until the location has been determined and the lines repaired or bypassed. The problem at the JSOC has been fixed and, until this new outage, the image cadence was being restored.
Update 11/6/2014 1447 UTC (9:47 am ET): The fiber optics provider has found the break, dug it up, and should be splicing the fiber links soon. I do not know how long each fiber takes to splice or how many fibers are in this bundle, so there is no estimate at this time when we will return to service.
Monday, December 30, 2013
Was Comet ISON Seen in AIA 4500?

The AIA 4500 image described in the blog is shown on the left. An arrow points to a bright area that is claimed to be fragments of Comet ISON breaking up near perihelion. A large format version is available from our jpeg archive on the SDO website.
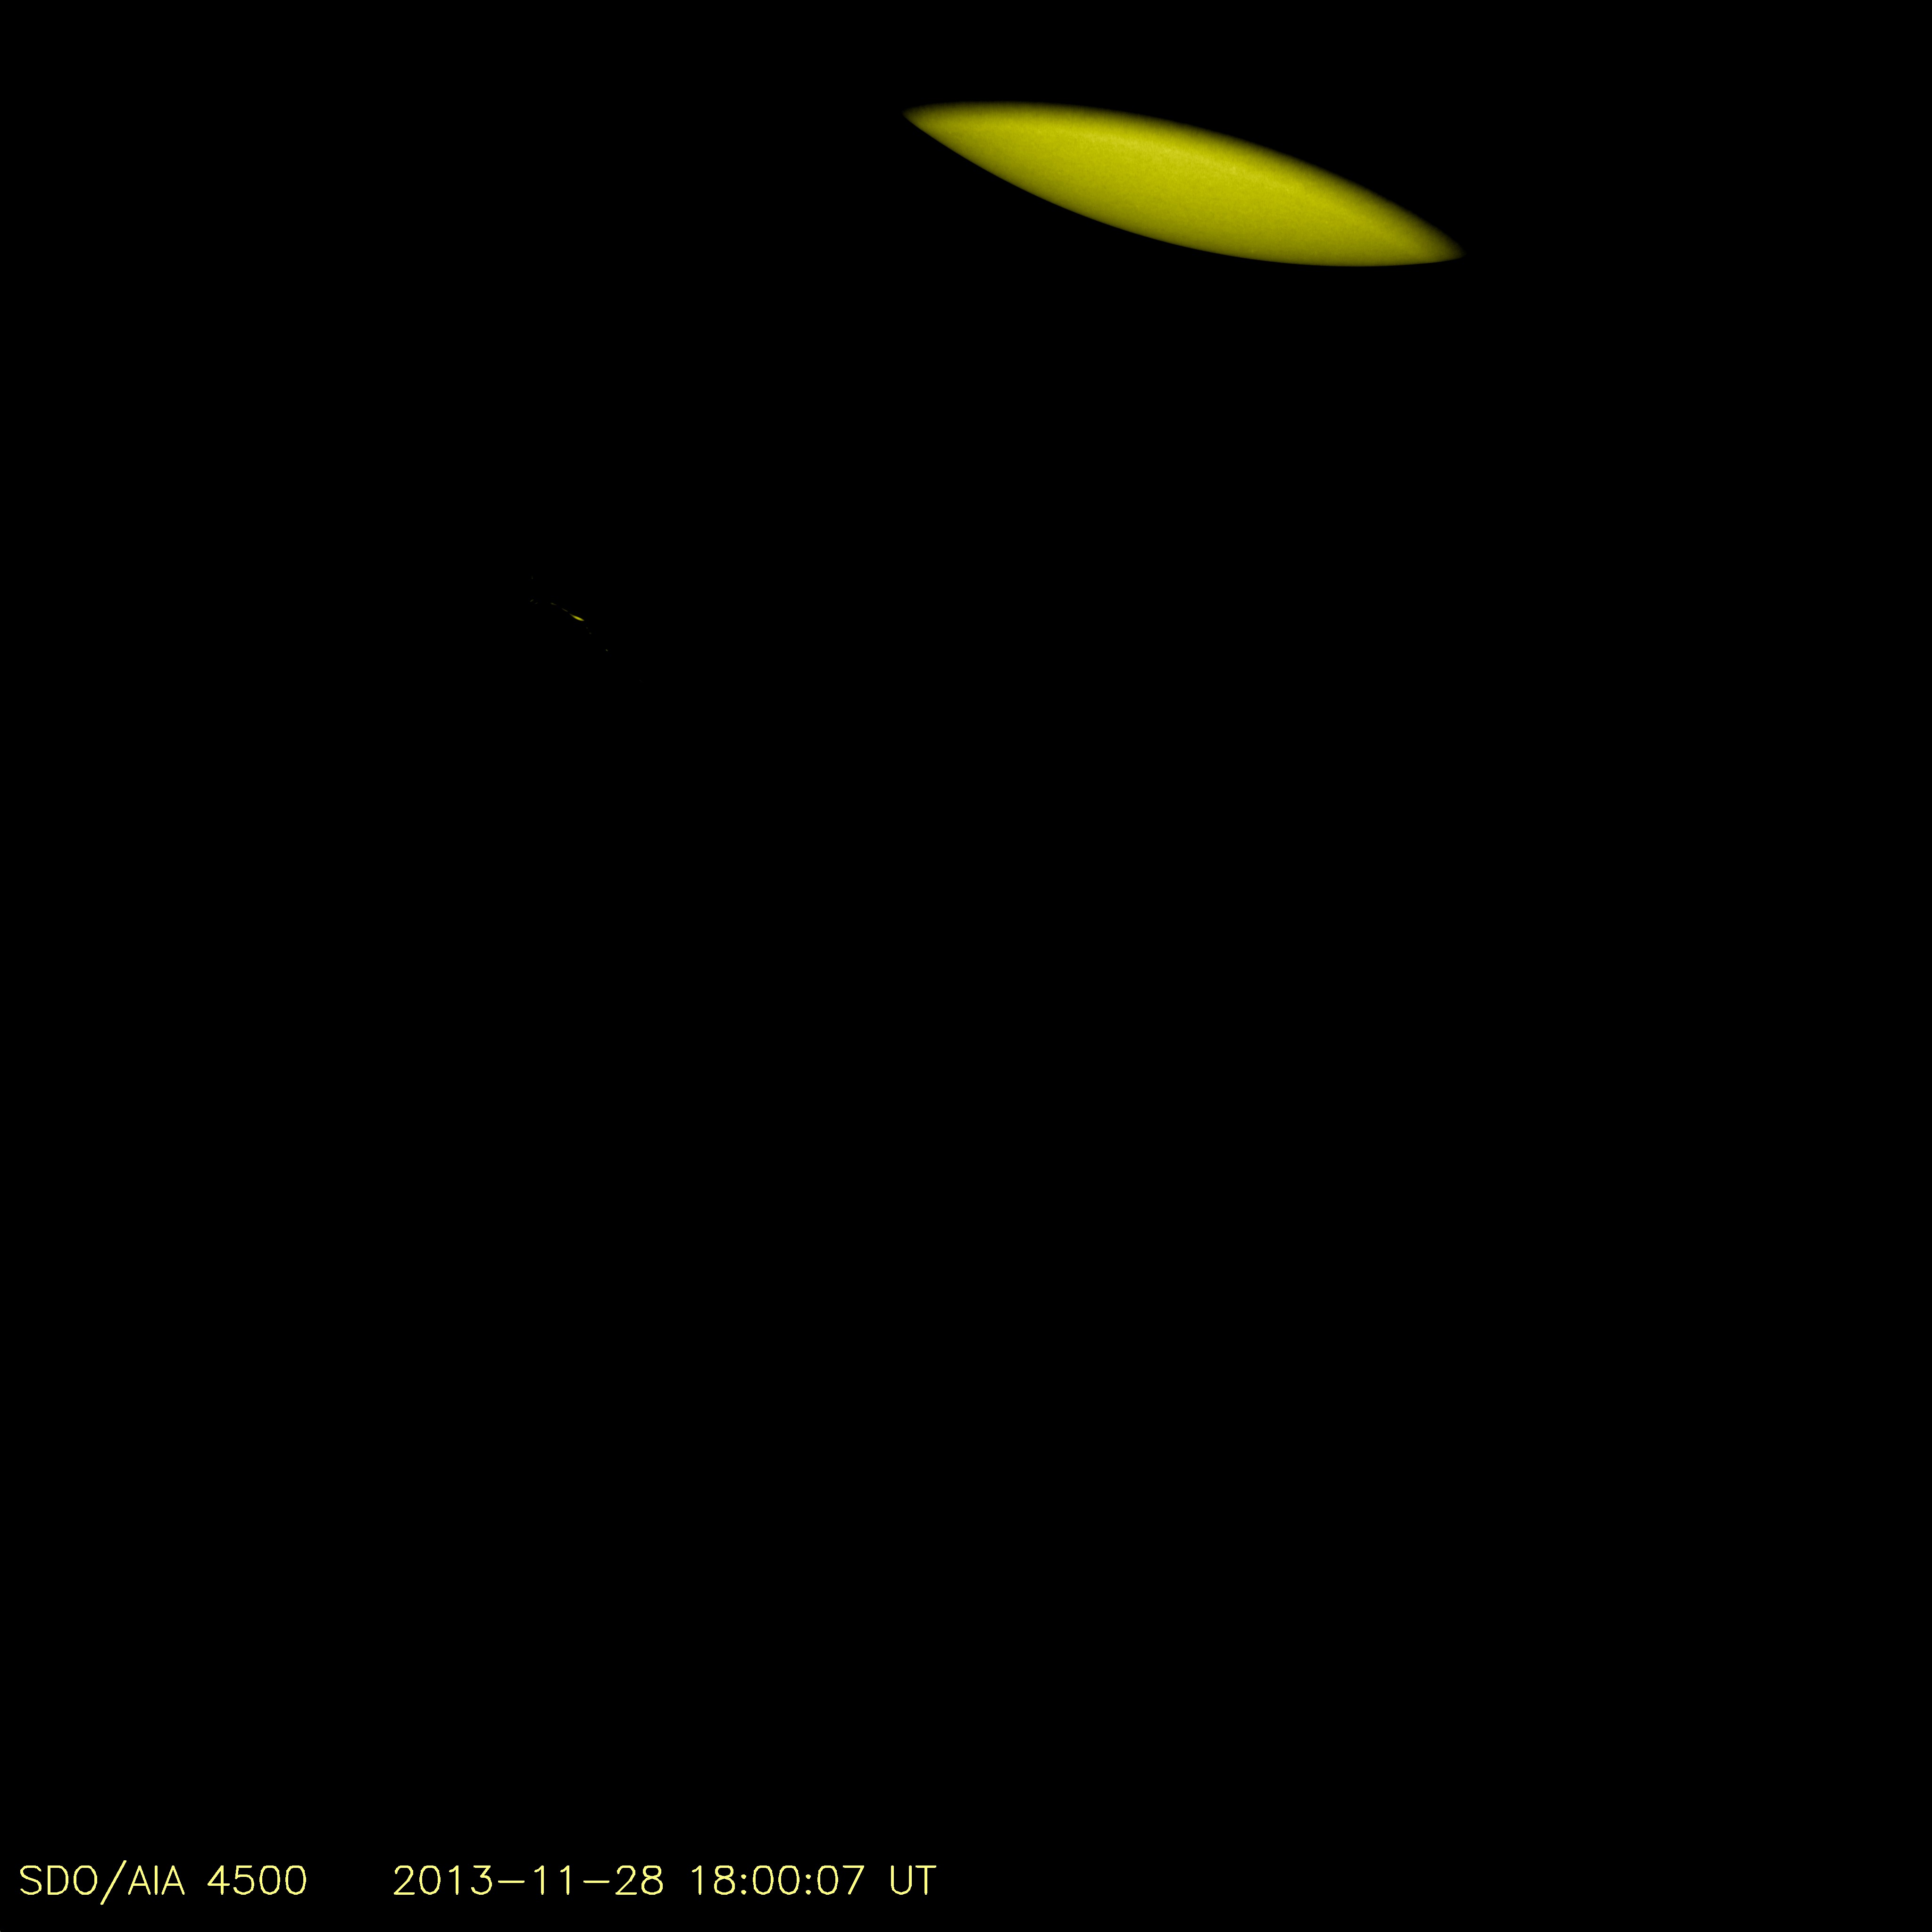
This bright area is an artifact resulting from stray light entering the telescope through a pinhole leak in one of the front filters. Our science data files are available from the SDO JSOC as fits (Flexible Image Transport System) files, the astronomy way to store image data. Each CCD image moves through a series of image processing to subtract the bias field, correct for dark current, subtract the flat field, remove proton hits, and other known effects. The final science data is the processed image. You need special software to work with fits files, so we convert the images to jpeg files to make them easier for a larger audience to use.


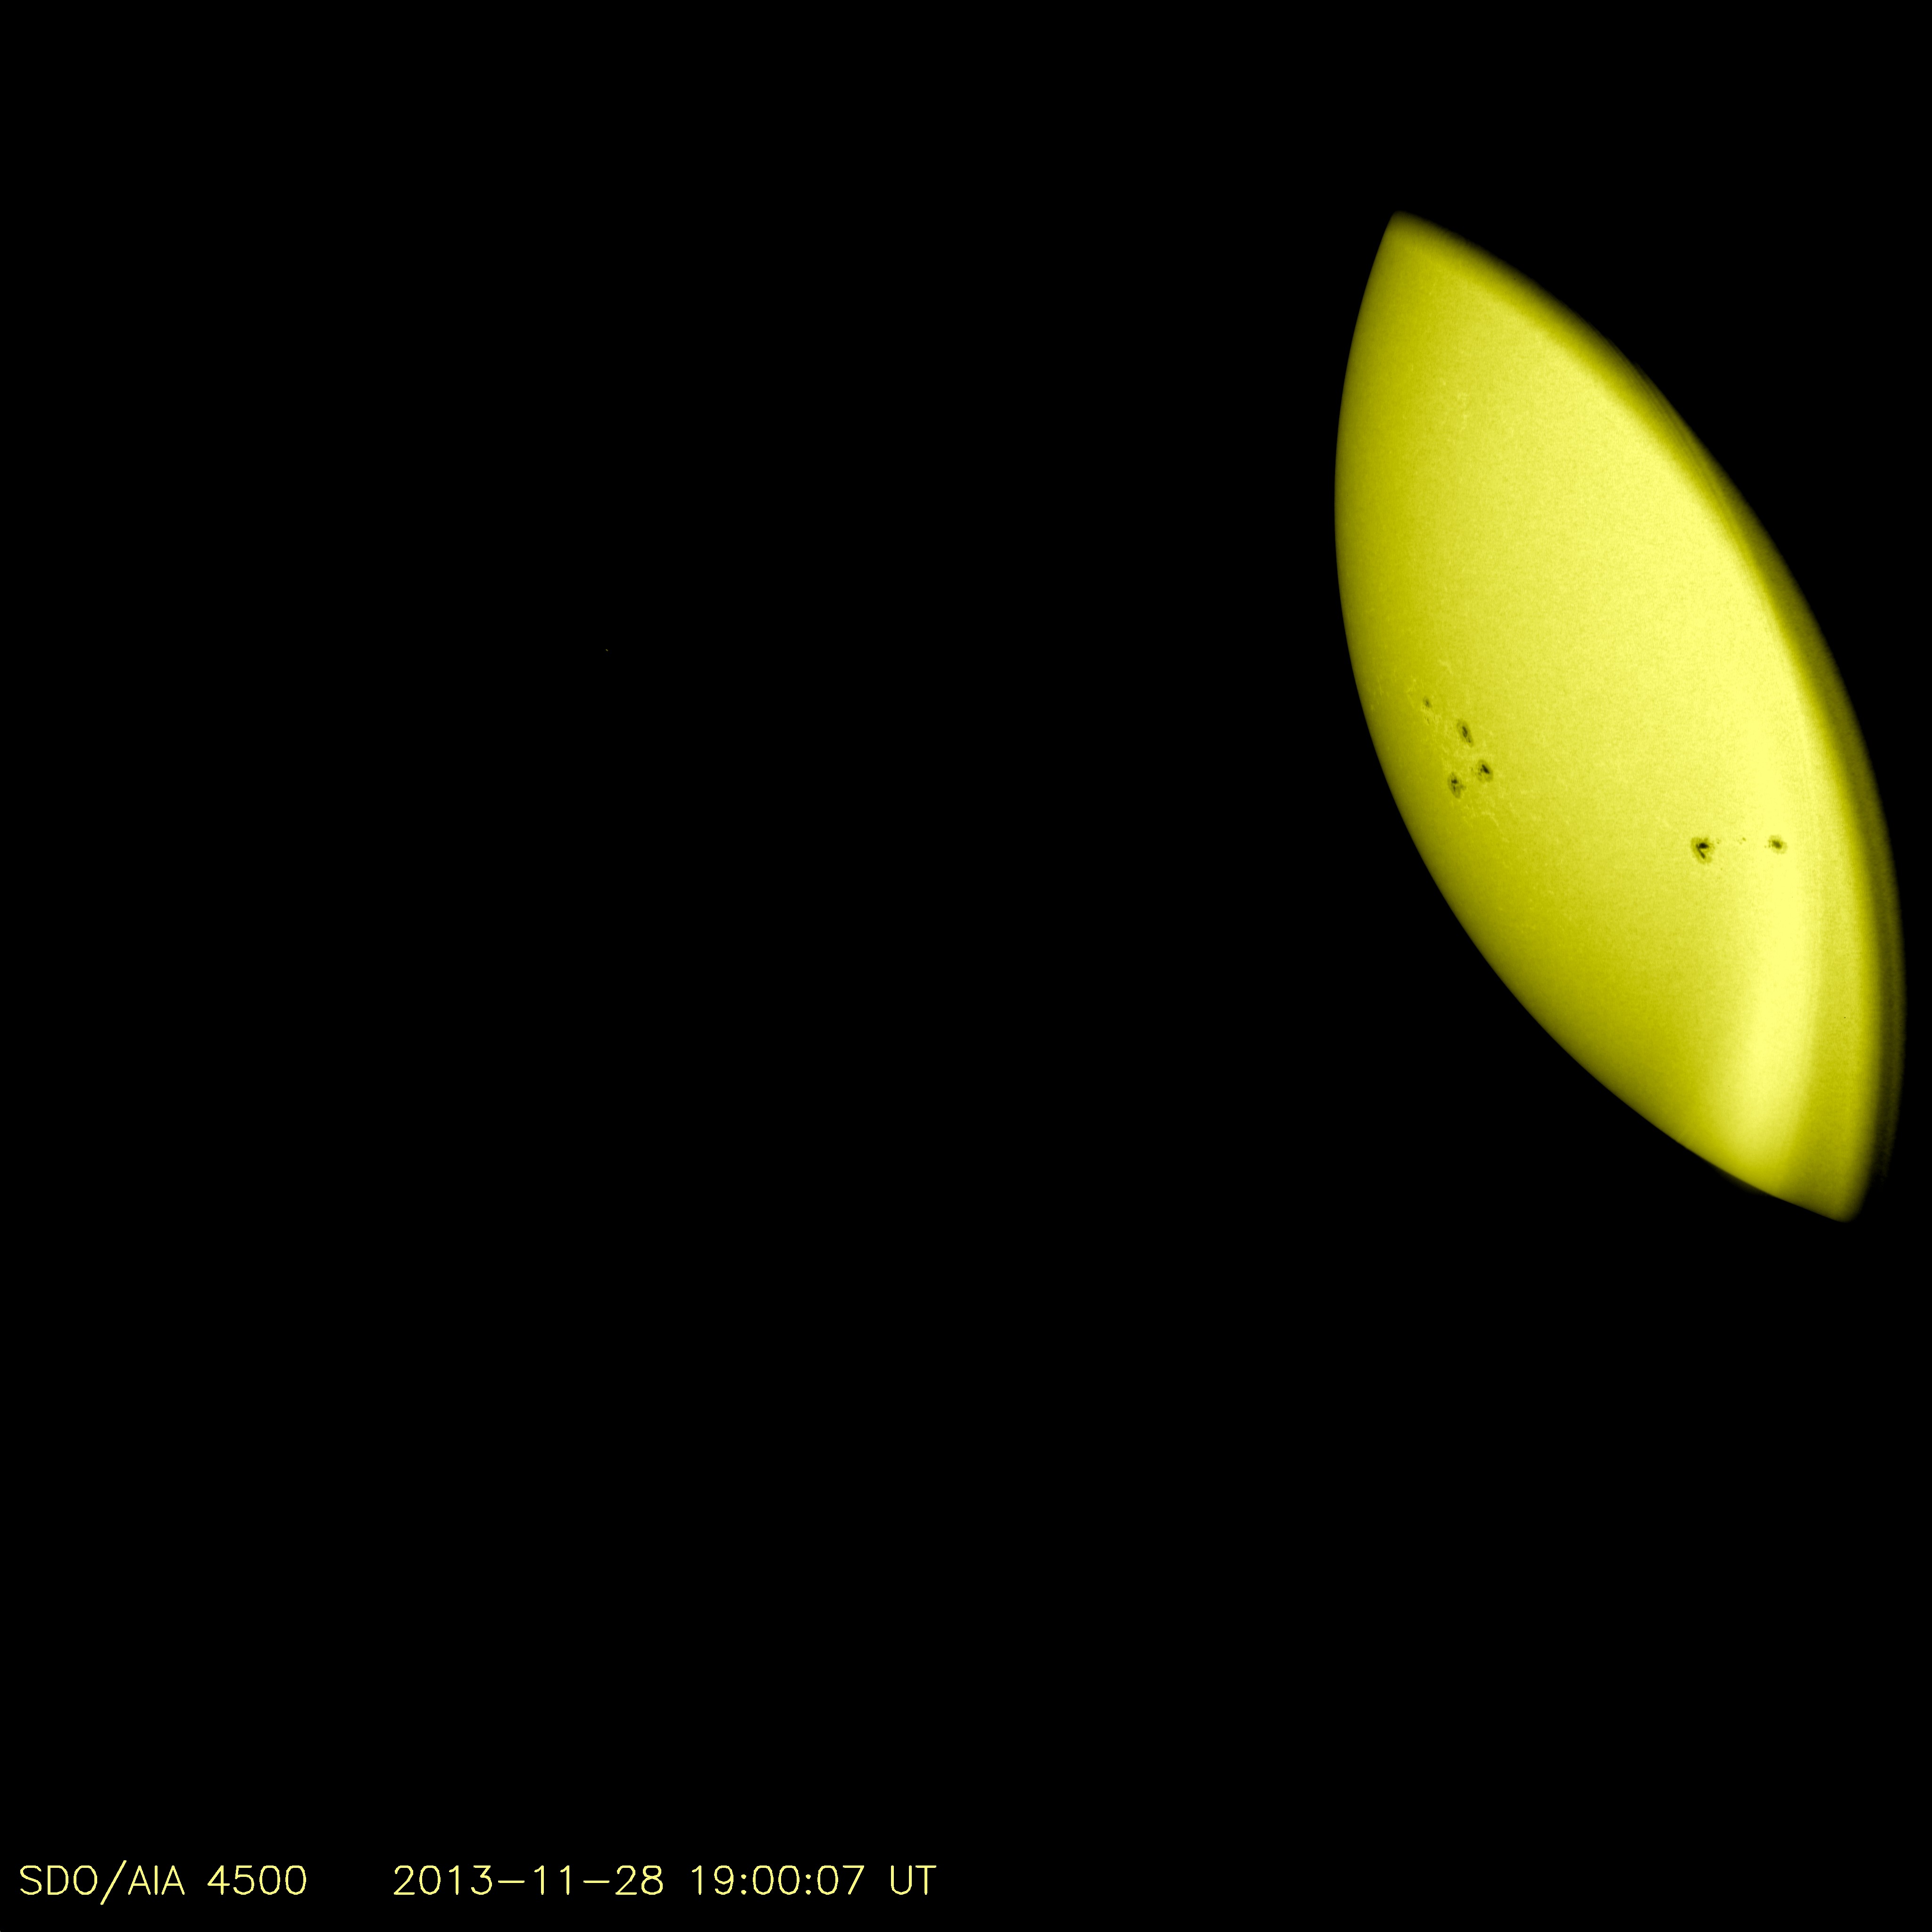
SDO Science Team members were very disappointed to not see Comet ISON as it flew by the Sun. We are convinced that SDO data does not reveal the presence of the cometary detritus.
Subscribe to:
Posts (Atom)